Introduction
The foundation of the healthcare system is the nurse, and being a good nurse requires rigorous training that begins on the first day of nursing school or college. Nursing students encounter difficult situations frequently throughout their studies. The student's health is seriously threatened by academic demands, adjusting to college and dorm life, living apart from family, and coping with a variety of patients (Cherkil S et al, 2013., Prasad CV,2013., Singh A, 2013., Yamashita K,2012). Students' health is frequently impacted by ongoing stress from a variety of sources, which increases their risk of experiencing mental health issues and psychosomatic illnesses. The coping mechanisms that students employ greatly influence how they perceive stress and how well they can manage it. Students who believe they are under a lot of stress and who find it difficult to deal with the situation may frequently suffer from a variety of physical and mental health issues (Carver CS et al, 1997., Tully A et al., 2004., Labrague LJ et al, 2014., Kaneko S et al, 215., Ho M, Wong VSW et al, 2015., Jones MC, 1999).1, 2, 3, 4, 5
Stress is a crucial and likely response of daily living, and is unavoidable because it related to any external incident, whether it is satisfying or worries producing. A person reaction towards stress found on whether an event is judged as a challenge or a warning. Challenging stimulus can bring constructive outcome for instance improved task performance and increase motivation. In other way threatening ones can lead social discomfort, depression, anxiety, and even develop suicidal intention. Stress is a necessary and likely reaction to everyday life that cannot be avoided because it is connected to every outside event, regardless of how rewarding or unsettling it may be (Bakhsh M et al, 2015). For nursing students, time management can be the most useful skill. To make more time for other critical tasks, nursing students may need to prioritise all of their activities. Additionally, one of the most crucial skills that everyone must master is time management. Therefore, mastering time management skills will aid pupils in feeling more at ease, focused, and in charge. Additionally, efficient time management techniques, such as prioritising tasks and defining goals, can increase productivity and decrease stress, which will improve work output (Eid N, et al 2013., Al Khatib A).6, 7, 8, 9
High expectations, information overload, academic pressure, unattainable goals, scarce chances, and intense competition all contribute to academic stress in the collegiate setting (Busari O et al.2012).
Hence the mn purpose of this study was to study the impact of time management program on stress and coping strategies adopted by nursing students with regard to academic performance.
Materials and Methods
Samples
Samples will be B.Sc. nursing students of selected colleges who fulfilled inclusion criteria.
Sample size
The sample size was 320 nursing students. Based on the formula
Where Zα =1.96 at 95% confidence level and Zβ =1.28 at 90% power
S= Combined Standard deviation and d= mean difference s=10.85 d=5.72. With 95% confidence level and 80% power wrt (Relationship between Effectiveness of Time Management and Stress levels among Nursing) sample size comes to be minimum of 80 in each group. Hence total sample will be 80 x 4 =320.
Data Analysis
The statistical calculations were performed using computer-based statistical software Statistical Package for the Social Sciences (SPSS) version 21.0
Results
Table 1
Range, mean, standard deviation and median of time management scores among Nursing Students
|
|
Range |
Mean |
SD |
Median |
|
Pre-test |
72-139 |
98.14 |
11.46 |
98.0 |
|
Post-test |
82-143 |
110.88 |
15.08 |
107.0 |
|
N=320 |
||||
Data presented in Table 1 revealed that the mean post-test time management score (110.88 ± 15.08) ranging from 82 to 143 was higher than the mean pre-test time management score (98.14 ± 11.46) ranging from 72 to 139.
Table 2
Range, mean, standard deviation and median of stress scores among Nursing Students
|
|
Range |
Mean |
SD |
Median |
|
Pre-test |
36-95 |
70.77 |
9.01 |
72.0 |
|
Post-test |
31-86 |
65.79 |
8.79 |
65.0 |
|
N=320 |
||||
Data presented in Table 2 revealed that the mean post-test stress score (65.79 ± 8.79) ranging from 31 to 86 was lower than the mean pre-test stress score (70.77 ± 9.01) ranging from 36 to 95.
Table 3
Mean, standard deviation, mean difference, t value and p value of time management scores before and after time management program among nursing students
|
Time |
Mean |
SD |
Mean difference |
‘t’ value |
p value |
|
Pre-test |
98.14 |
11.46 |
12.74 |
10.711 |
<0.001 |
|
Post-test |
110.88 |
15.08 |
|
|
|
|
T (319 =1.650 at 0.05 level of significance |
|||||
The data presented in Table 3 depicts the mean, standard deviation, mean difference, t value and p value of time management scores before and after time management program among nursing students. Data revealed that the mean time management during post-test (110.88 ± 15.08) was higher than that of pre-test (98.14 ± 11.46). The t value obtained (10.711) was higher than the table value (1.650) at 0.05 level of significance. 10, 11, 12, 13, 14, 15, 16
Hence, the null hypothesis was rejected and research hypothesis was accepted. Therefore, the mean time management score was significantly different before and after time management programme.
Table 4
Mean, standard deviation, mean difference, t value and p value of stress scores before and after time management program among nursing students
|
Time |
Mean |
SD |
Mean difference |
‘t’ value |
p value |
|
Pre-test |
70.77 |
9.01 |
4.98 |
10.761 |
<0.001 |
|
Post-test |
65.79 |
8.79 |
The data presented inTable 4 depicts the mean, standard deviation, mean difference, t value and p value of stress scores before and after time management program among nursing students. Data revealed that the mean stress score during post-test (65.79 ± 8.79) was lower than that of pre-test (70.75± 9.02). The t value obtained (10.761) was higher than the table value (1.650) at 0.05 level of significance. Hence the null hypothesis was rejected and research hypothesis was accepted. Therefore, the mean stress score was significantly different before and after time management programme.17, 18, 19, 20, 21, 22
Table 5
Mean, standard deviation, mean difference, t value and p value of academic performance scores before and after time management program among nursing students
|
Time |
Mean |
SD |
Mean difference |
‘t’ value |
p value |
|
Pre-test |
22.79 |
3.90 |
3.73 |
17.169 |
<0.001 |
|
Post-test |
26.52 |
4.84 |
|||
|
t(319)=1.650 at 0.05 level of significance |
|||||
The data presented in table 05 depicts the mean, standard deviation, mean difference, t value and p value of academic performance scores before and after time management program among nursing students. Data revealed that the mean academic performance score during post-test (26.52 ± 4.84) was higher than that of pre-test (22.79± 3.90). The t value obtained (17.169) was higher than the table value (1.650) at 0.05 level of significance.
Hence the null hypothesis was rejected and research hypothesis was accepted. Therefore the mean academic performance score was significantly different before and after time management programme.
Table 6
Distribution of samples according to level of time management before and after intervention
|
Sl. no |
Level of time management |
Scoring |
Pre-test |
Post-test |
||
|
|
f |
% |
f |
% |
||
|
1 |
Poor |
≤45 |
0 |
0 |
0 |
0 |
|
2 |
Average |
46-91 |
88 |
27.5 |
24 |
7.5 |
|
3 |
Good |
92-136 |
229 |
71.6 |
268 |
83.8 |
|
4 |
Excellent |
137-182 |
3 |
0.9 |
28 |
8.8 |
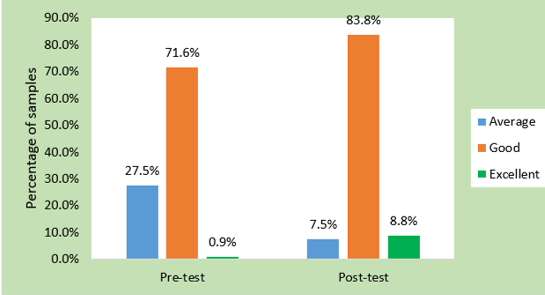
Data presented in Table 6 revealed that majority of samples (71.6%) were having good level of time management followed by 27.5% having average and 0.9% having excellent time management score during pre-test. Where as in post-test, most of the samples had (83.8%) good time management score followed by 8.8 % having excellent and 7.5 % having average.
Table 7
Distribution of samples according to level of stress before and after intervention
|
Sl. no |
Level of stress |
Scoring |
Pre-test |
Post-test |
||
|
f |
% |
f |
% |
|||
|
1 |
Low stress |
≤50 |
8 |
2.5 |
16 |
5.0 |
|
2 |
Moderate |
51-75 |
210 |
65.6 |
262 |
81.9 |
|
3 |
High |
>75 |
102 |
31.9 |
42 |
13.1 |
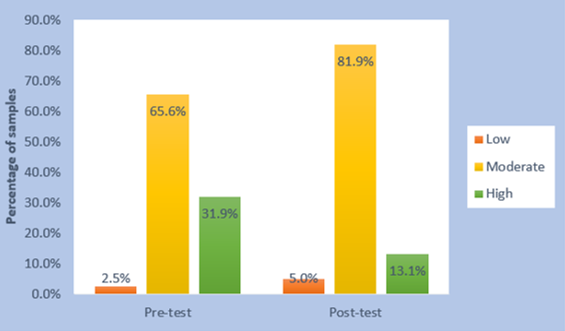
Data presented in Table 7 revealed that majority of samples (65.6%) were having moderate level of stress followed by 31.9% having high and 2.5 % having low stress. Where as in post-test, most of the samples had (81.9%) moderate stress score followed by 13.1 % having high and 5% having low stress score.
Table 8
Distribution of samples according to level of academic performance before and after intervention
|
Sl. no |
Level of academic performance |
Scoring |
Pre-test |
Post-test |
||
|
|
f |
% |
f |
% |
||
|
1 |
Poor |
20 |
79 |
24.7 |
40 |
12.5 |
|
2 |
Average |
20-30 |
235 |
73.4 |
205 |
64.1 |
|
3 |
Good |
31-40 |
6 |
1.9 |
75 |
23.4 |
|
N=320 |
||||||
Data presented in Table 8 revealed that majority of samples (73.4%) were having average academic performance score followed by 24.7 % having poor and 1.9% having good academic performance. Where as in post-test, majority of the samples had (64.1%) average academic performance score followed by 23.4 % having good and 12.5 % having poor academic performance score.
Table 9
Correlation between time management programme and stress score among nursing students.
|
Variables |
Mean |
Standard deviation |
r value |
p value |
Type of correlation |
|
Time management score |
98.14 |
11.46 |
-0.337 |
<0.001*** |
Moderate negative |
|
Stress score |
70.77 |
9.01 |
|||
|
N=320 |
|||||
Data presented in Table 9 revealed that there was a significant moderate negative correlation between time management score and stress score among nursing students (r=-0.337, p<0.001).
Figure 4
Scatter diagram representing correlation between time management programme and stress score among nursing
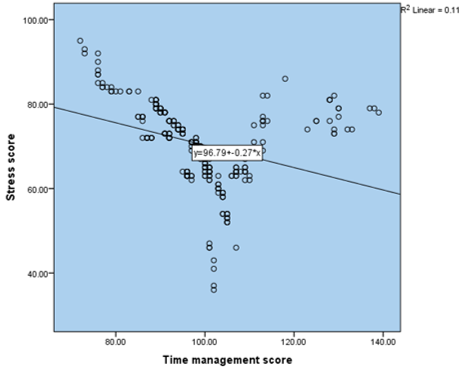
Table 10
Correlation between level of stress and academic performance score among nursing students.
|
Variables |
Mean |
Standard deviation |
r value |
p value |
Type of correlation |
|
Stress score |
70.77 |
9.01 |
-0.512 |
<0.001*** |
Moderate negative |
|
Academic performance score |
22.79 |
3.90 |
|||
|
N=320 |
|||||
Data presented in Table 10 revealed that there was a significant moderate negative correlation between level of stress and academic performance score among nursing students (r=-0.512, p<0.001).
Figure 5
Scatter diagram representing correlation between academic performance and stress score among nursing student
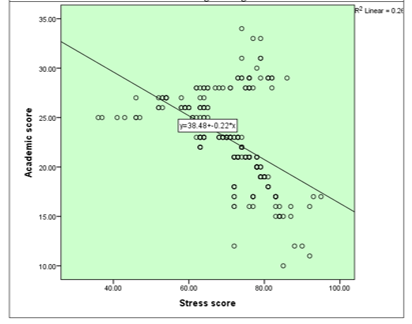
Table 11
Association of stress score with demographic variable
Data presented in Table 11 shows the association of stress score of nursing students with their demographic variables. Data revealed that there was a significant association between stress score and age (χ2= 13.092, p<0.001), type of family (χ2= 7.568, p<0.01), education status of father (χ2= 47.949, p<0.001), sleep per day (χ2= 17.355, p<0.001), presence of supplementary papers (χ2= 6.713, p<0.05) and number of supplementary papers (χ2= 14.664, p<0.01). Therefore the null hypothesis was rejected and research hypothesis was accepted for these variables.
However no significant association was found between stress score and year of study (χ2= 0.909, p>0.05), gender (χ2= 0.735, p>0.05), religion (χ2= 2.329, p>0.05, education status of mother (χ2= 5.190, p>0.05), number of siblings (χ2=0.617, p>0.05), birth order (χ26.404, p>0.05), area of residence (χ2=2.311, p>0.05) and monthly income of family (χ2= 0.345, p>0.05). Therefore, null hypothesis was accepted for these variables.
Discussion
The nursing profession is both stressful and emotionally taxing. Nurses engage with a variety of people in a variety of settings at various times of the day. They deal with incredibly emotional situations that are always changing in their line of work (Forouzanfar MH, et al 2015).
Data presented in Table 1 revealed that the mean post-test time management score (110.88 ± 15.08) ranging from 82 to 143 was higher than the mean pre-test time management score (98.14 ± 11.46) ranging from 72 to 139 and mean post-test stress score (65.79 ± 8.79) ranging from 31 to 86 was lower than the mean pre-test stress score (70.77 ± 9.01) ranging from 36 to 95 which were similar to a study done by Fatemeh Vizeshfar et al, 2006
This study found that the p value of time management scores before and after time management program among nursing students which revealed that the mean time management during post-test (110.88 ± 15.08) was higher than that of pre-test (98.14 ± 11.46). The t value obtained (10.711) was higher than the table value (1.650) at 0.05 level of significance which were similar to study done by Feng Zhang et al, 2020.
This study revealed that the mean stress score during post-test (65.79 ± 8.79) was lower than that of pre-test (70.77± 9.02). The t value obtained (10.761) was higher than the table value (1.650) at 0.05 level of significance. Hence the null hypothesis was rejected and research hypothesis was accepted. Therefore, the mean stress score was significantly different before and after time management programme when compared to mean perceived stress scale score of 22.78 (8.54) which revealed that nearly half of the students (47.92%) reported experiencing moderate levels of stress. Senior nursing students reported feeling more stressed than fresher’s as per Maria Dolores Onieva-Zafra et al, 2020.
This study revealed that the mean academic performance score during post-test (26.52 ± 4.84) was higher than that of pre-test (22.79± 3.90). The t value obtained (17.169) was higher than the table value (1.650) at 0.05 level of significance. Hence the null hypothesis was rejected and research hypothesis was accepted. Therefore, the mean academic performance score was significantly different before and after time management programme that compared to the findings showing a substantial correlation between the nursing students' academic performance and the entrance requirements which is significantly correlated with a number of factors in the entrance criteria, including SSC grades (r = 0.32, p 0.001), previous academic performance at the diploma level (r = 0.48, p 0.001), and entry test scores (r = 0.26, p 0.001) as per Imran Inayat Yousafzai et al.
This study reveals that majority of samples (71.6%) were having good level of time management followed by 27.5% having average and 0.9% having excellent time management score during pre-test. Where as in post-test, most of the samples had (83.8%) good time management score followed by 8.8 % having excellent and 7.5 % having average.
Data presented in Table 7 revealed that majority of samples (65.6%) were having moderate level of stress followed by 31.9% having high and 2.5 % having low stress. Where as in post-test, most of the samples had (81.9%) moderate stress score followed by 13.1 % having high and 5% having low stress score which are comparable to study done by Lucia Filomeno et al, 2020
This reveals that majority of samples (73.4%) were having average academic performance score followed by 24.7 % having poor and 1.9% having good academic performance. Where as in post-test, majority of the samples had (64.1%) average academic performance score followed by 23.4 % having good and 12.5 % having poor academic performance score when compared study done on male and female students who had mean grade point averages of 2.88 (SD = 0.220) and 2.61 (SD = 0.204), respectively including grade point average, where female students performed better than male pupils (P< 0.05) as per Damayanthi, H et al, 2016,
This study revealed that there was a significant moderate negative correlation between time management score and stress score among nursing students (r=-0.337, p<0.001) and moderate negative correlation between level of stress and academic performance score among nursing students (r=-0.512, p<0.001 comparable to study that revealed a statistically significant negative association between the students' TMQ scores and their state anxiety and trait anxiety scores (r = 0.282, p <0.001 and r = 0.325, p <0.001, respectively) as per Ghiasv and AM, 2017.
This study shows that the association of stress score of nursing students with their demographic variables. Data revealed that there was a significant association between stress score and age (χ2= 13.092, p<0.001), type of family (χ2= 7.568, p<0.01), education status of father (χ2= 47.949, p<0.001), sleep per day (χ2=17.355, p<0.001), presence of supplementary papers (χ2=6.713, p<0.05) and number of supplementary papers (χ2= 14.664, p<0.01). Therefore, the null hypothesis was rejected and research hypothesis was accepted for these variables. However no significant association was found between stress score and year of study (χ2= 0.909, p>0.05), gender (χ2= 0.735, p>0.05), religion (χ2= 2.329, p>0.05, education status of mother (χ2= 5.190, p>0.05), number of siblings (χ2=0.617, p>0.05), birth order (χ26.404, p>0.05), area of residence (χ2=2.311, p>0.05) and monthly income of family (χ2= 0.345, p>0.05). Therefore, null hypothesis was accepted for these variables.
Conclusion
The results of this study showed that academic stress is a common issue among nursing students because all nursing students reported experiencing moderate to high levels of stress. Academic stress is a multifaceted issue with numerous risk variables, including student age, sex, academic year, location, marital status, and social standing; yet, a sound strategy will result in strong academic achievement and lower dropout rates.

