Introduction
According to United Nations - World Population Prospects (2022) the current population of India in 2022 is 1,406,631,776, a 0.95% increase from 2021, population 1,393,409,038. According to UNICEF India has the largest adolescent population in the world, 253 million. India stands to benefit, socially, politically and economically if this large number of adolescents are safe, healthy, educated for the nation of 1.39 billion. WHO defines 'Adolescents' as individuals in the 10-19 years age group and 'Youth' as the 15-24 years age group. 1
Adolescent period is signalized by marked physical activity and rapid growth spurt; therefore, they need additional nutritional supplements and are at utmost risk of developing nutritional anaemia. Nutritional anemia is a worldwide problem, with the highest prevalence in developing countries. Anemia occurs when the number of healthy red blood cells is insufficient to meet the body’s physiological needs for oxygen delivery to the brain, heart, muscles and other vital tissues. Hemoglobin is the primary oxygen-carrying molecule within red blood cells, so anemia is most typically measured in terms of hemoglobin content of the blood rather than red blood cell volume. Anemia is considered as the most common cause of malnutrition and it has great significance in public health affecting children, adolescents and reproductive age group women in worldwide. Anaemia play a major role in affecting the adolescents especially girls. The World Health Organization global estimates of anemia prevalence averaged 56%, with a range of 35%–75% depending on geographic location. In India, the prevalence of anemia is 52%.2
A major problem of a girl is a menstrual period. During this period a girl used to lose approximately 45 ml of blood i.e. 22 mg of iron which leads most of the girls to get affect with anemia.3
Sunuwar D. R., Singh D. R., Chaudhary N. K., Pradhan P. M. S., Rai P. & Tiwari K. (2020) results from multiple logistic regression suggest that likelihood of anemia is significantly higher among younger women (15–24 years), women with primary or no education, women from the poorest wealth quintile, women without toilet facilities.4
One of the major health issues in adolescent Girls is an Iron Deficiency Anemia, which can be reduced by consumption of Drumsticks leaves. Drumstick leaves (DL) with its high beta carotene content (19690 mcg/100g) along with vitamin C from lemon juice may have a positive impact in the mobilization of stored iron and increase hemoglobin levels of anemic subjects. Vitamin C is a well known enhancer of iron bioavailability. Moringa oleifera tree is of sub-Himalayan origin requires very little attention and can survive in arid regions. The transcriptome data indicates multiple stress-responsive genes such as C2H2 and Myb gene families. Together, it provides compelling evidence that this plant is a ‘superfood’ and can provide nutritional sustenance. Studies show that the leaves of Moringa oleifera tree contain 30 times more iron and 100 times more calcium than spinach. “Indeed, iron, zinc and magnesium transporters were found to be highly abundant in the roots and stem parts of this tree.” says Dr. Naseer Pasha.5
Objective of The Study
Assess the pre test hemoglobin level among anemic females in experimental and control group.
Determine the effect of Moringa Oleifera leaves juice to increase the haemoglobin level among anemic females.
Research hypothesis
H1:- There will be significant difference between pre-test and post-test hemoglobin level with the effect of Moringa Oleifera leaves juice among anemic females in experimental and control group at 0.05 level of significance.6
Materials and Methods
Research approach
Quantitative research approach was used to assess the effect of Moringa Oleifera leaves juice to increase the haemoglobin level.
Research design
Quasi experimental non randomized control group design (non-equivalent control group design) was adopted to assess the effect of Moringa Oleifera leaves juice.
Sample and sample size
30 Anemic females (15-24 years of age) in selected rural areas of Indore, M P
Data Analysis and Interpretation
Section-I: Distribution of anemic females according to their demographic variable.
Table 1
Frequency and percentage distribution of anemic females in experimental and control group according to their demographic variables N=15
Table 0
Distribution of anemic females according to their demographic variables shows that maximum of the sample (40%) were in 22-24 years of age in experimental group whereas in control group there was equal distribution of sample in all the age categories. In both the experimental group and control group (100%) of the sample were Hindu in religion.7 In education of samples (66.7%) and (60%) in experimental and control group were having high school and higher secondary education. In experimental group majority (66.7%) and (60%) in control group were single in marital status. In both the experimental and control group majority of the samples (33.3%) and (47.7%) were students. In relation to type of family, mostly (47.7%) belongs to joint family in both experimental and control group. Regarding monthly income of the family, maximum (60%) and (80%) family of the samples had an income between Rs. 16001 and above in experimental and control group respectively. in both experimental and control group (66.7%) get information regarding anemia from relatives and peer group.8 Most of the samples (80%) in experimental and (73.3%) in control group had no family history of anemia. In both the groups mostly (86.7%) of samples had no medical person in the family and maximum (87%) of their menarche age is between 13-15 years. With regards to the pattern of menstruation majority of the samples (80%) had regular menstruation in both the groups. Concerning the flow of menstruation largest number (73.3%) & (80%) of them had normal flow and (93.3%) in 3-5 days of menstruation in experimental and control group. Mostly (66.7%) of them belongs to vegetarian in experimental group whereas (53.3%) belongs to mixed vegetarian type of diet in control group. Almost all (100%) and (80%) of them had intake of beverages in experimental and control group. In both the groups no samples practice deworming. Largest number of samples (86.7%) & (93.3%) had not walk barefoot in experimental & control group respectively.9 All the samples (100%) has practice of washing hands with soap after each defecation. Regarding hand washing practice maximum (80%) & (66.7%) of them use to wash hands with soap and water in experimental & control group respectively. Majority of the samples (66.7%) and (86.7%) has no habit of trimming and keeping nails short regularly in experimental & control group.10
Section-II: Distribution of anemic females according to observational checklist.
Table 2
Frequency and percentage distribution of anemic females in experimental and control group according toobservational checklist.
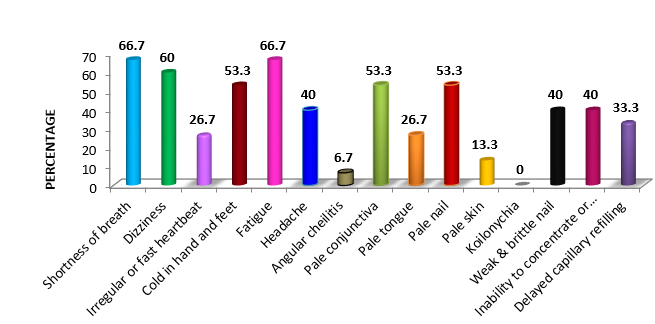
Graph 1
Percentage distribution of anemic females in experimental group according to observational checklist.

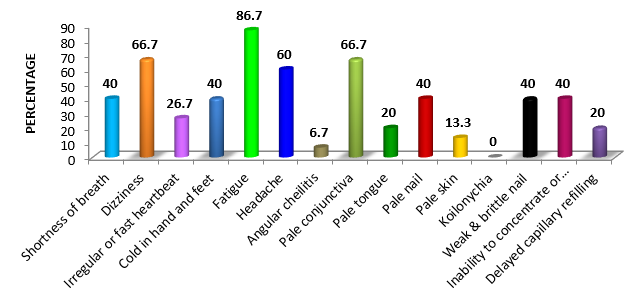
Graph 2
Percentage distribution of anemic females in control group according to observational checklist

Table 3
Frequency and percentage distribution ofpre-test and post-test hemoglobin level among anemic females in experimental group N = 15
|
Lvel of Hemoglobin |
Moderate |
Mild |
Normal |
Mean |
S.D. |
|||
|
Frequency |
% |
Frequency |
% |
Frequency |
% |
|||
|
Pre test |
7 |
46.7 |
8 |
53.3 |
0 |
0 |
9.6 |
0.98 |
|
Post test |
1 |
6.7 |
10 |
66.6 |
4 |
26.7 |
10.9 |
1.03 |
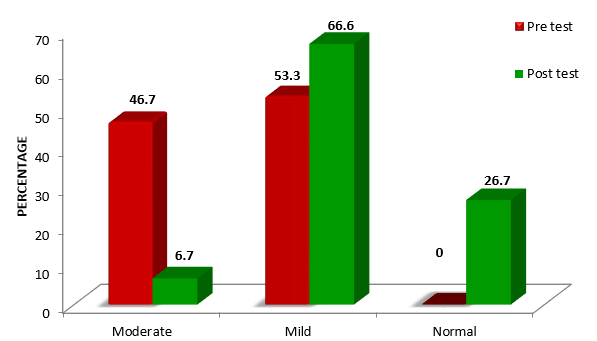
Graph 3
Bar diagram showing frequency and percentage distribution of pre test and post test hemoglobin level among anemic females in experimental group.

Table 4
Frequency and percentage distribution of pre test and post test hemoglobin level among anemic females in control groupN = 15
|
Lvel of Hemoglobin |
Moderate |
Mild |
Normal |
Mean |
S.D. |
|||
|
Frequency |
% |
Frequency |
% |
Frequency |
% |
|||
|
Pre test |
6 |
40 |
9 |
60 |
0 |
0 |
9.6 |
0.97 |
|
Post test |
6 |
40 |
8 |
53.3 |
1 |
6.7 |
9.9 |
0.96 |
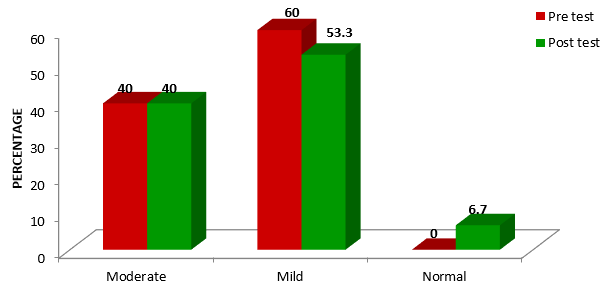
Graph 4
Bar diagram showing frequency and percentage distribution of pre test and post test hemoglobin level among anemic females in control group.

Table 5
Comparision of mean and standard deviation of hemoglobin level to assess the effecte of Moringa Oleifera leaves juice to increase the haemoglobin level among anemic N = 15
|
Group |
Mean |
Mean difference |
Standard deviation |
‘t’ value |
|
|
Experimental group |
Pre test |
9.6 |
1.33 |
0.98 |
10.6* Df 14 |
|
Post test |
10.9 |
1.03 |
|||
|
Control group |
Pre test |
9.6 |
0.3 |
0.97 |
2.3 Df 14 |
|
Post test |
9.9 |
0.96 |
|||
Section III: Assessment of pre-test and post-test hemoglobin level among anemic females in experimental group.
The data in the table reveals that among anemic females in experimental group, 8 (53.3 %) had mild level of anemia and 7 (46.7 %) had moderate level of anemia in pre-test and 10 (66.6 %) had mild level of anemia, 1 (6.7 %) had moderate level of anemia and 4(26.7%) had no anemia in post-test.
Section IV: Assessment of pre test and post test hemoglobin level among anemic females in control group
Section V: Comparision of mean and standard deviation of hemoglobin level in experimental and control group.
The data in the table reveals that among anemic females in control group, 9 (60 %) had mild level of anemia and 6 (40 %) had moderate level of anemia in pre-test and 8 (53.3 %) had mild level of anemia, 6 (40 %) had moderate level of anemia and 1 (6.7%) had no anemia in post-test.
