Introduction
The hemoglobinopathies are the most common single-gene defect in man. The prevalence of them is on the rise worldwide. The frequency of carrier state is around 270/million with about 400,000 annual births a year of infants with serious hemoglobinopathies. This is of special importance in developing countries, where it increases the burden of health care systems.1, 2
Thalassemia has a spectrum of clinical severity which is associated with ineffective erythropoiesis, bone marrow expansion and rapid destruction of erythrocytes. Due to frequent transfusions, hemosiderosis and other complications of the disease require continuous iron chelation therapy, regular medical supervision, frequent admission and on many occasions splenectomy. The only curative treatment is bone marrow transplantation (BMT) which is expensive and has a variable success rate of 60-70%.3
Growth retardation often affecting their social adjustments and quality of life. Close monitoring of physical growth may lead to early identification and treatment of these complications to ensure that patients achieve near-normal adult height.4
The problem in India
Data is available only from few centres and as such, no statistics are available regarding their physical growth in recent time especially from the east side of India. India has a large number of young patients with transfusions dependent thalassemia and very few studies have reported the issues related to physical growth in children. Keeping this in mind, the present study is undertaken with the aim to study physical growth in transfusion-dependent thalassemic children and to see whether any difference of physical growth between those who regularly transfused and those irregularly transfused.
Materials and Methods
This is a cross-sectional, observational, single-centre, tertiary hospital-based study conducted in Department of Paediatrics, Medical College and Hospital, Kolkata-73 over a period of 1 year from April 2018 to March 2019. Inclusion Criterias taken were as follows: 1. All affected children of beta-thalassemia major and Hb E/Beta thalassemia of 2-12 years of age. 2. Parents/ guardians consenting to enrol in the study. Exclusion Criterias were — 1. Sickel cell thalassemia. 2. Thalassemia children with other co morbidities like Tuberculosis, Chronic kidney disease etc.
Detailed history and clinical examination done at admission involving all related systems & Routine laboratory tests like- 1. Complete haemogram 2. serum ferritin 3. pre-transfusion haemoglobin and some special tests like LFT(Liver function test), RFT(Renal function test), Serology, Thyroid profile were performed. Echocardiography was done only in selected cases. Detailed Anthropometry was done in terms of — weight for age, height for age, BMI (>5 years), mid-upper arm circumference, upper segment lower segment ratio, sexual maturity according to Tanner scale using Weighing machine, Stadiometer, Measuring Tape, Pradder’s orchidometer, WHO Growth chart for 2-5 years and IAP growth chart for >5 years.
Predesigned, pre validated case record forms were used to record the relevant demographic, history, clinical, laboratory data for each child. Microsoft Excel and SPSS 20.0 software were used to analyse the data.
Results and analysis
Among the 200 children, 143 (71.5%) were taking regular (2-4 weekly)transfusion therapy and 57 (28.5%) were taking irregular(>4weekly) transfusion. Among 143 of Irregularly transfused patients 75(64.6%) were Boy and 68(80.9%) were Girl and among 57 of regularly transfused patients 41(35.4%%) were Boy and 16(19.1%) were Girl. Majority of the Regularly transfused thalassemic children, that is 26 (45.6%) out of 57 in the present study were between 10-12 years (Table 1). In the present study the minimum age of diagnosis 8 months and maximum 48 months. Mean age of diagnosis was 18.66 ± 7.443months in Group 1 (Irregularly transfused) and 18.93 ± 7.218 months in Group 2 (Regularly transfused). (Table 2). Among 143 of Irregularly transfused patients 64(76.1%) were Hindu and 79(68.1%) were Muslim and among 57 of regularly transfused patients 20(23.9%) were Hindu and 37(31.9%) were Muslim (Table 3). Among the regularly transfused thalassemic children 17.7% had W/A < 3rdpercentile and among the irregularly transfused children it was 15% (Table 4.1 & 4.2). Among the irregularly transfused children, 27. 1% and among the regularly transfused children 21.6% had H/A <3rd percentile (Table 6.1 & 5.2). In the present study children 61% had normal BMI and only 5.4 % had BMI less than 3rd percentile overall (Table 8).
A positive correlation between pre-transfusion haemoglobin and W/A and H/A suggested that with decreasing pre-transfusion haemoglobin concentration more child had growth retardation. Among irregularly transfused thalassemic children >10years of age, 86.7% have not attained puberty yet. Among the regularly transfused thalassemic children 96.7% have not attained puberty yet (Table 9). US and LS individually affected resulting in stunting but it was proportionate in nature so US: LS ratio was according to age (Table 10). Mean MUAC in the present study was 12.44cm suggesting mild-moderate malnutrition (Table 12). Pallor was the most common presenting features between both groups. Most of them came for blood transfusion. 5% of them had jaundice with abnormal liver function test, 31% had haemic murmur, 6.5% had crepitations in chest, 10.5% had positive serology either for hepatitis B or hepatitis C or HIV, 4.5% had deranged renal function test, 9% had abnormal thyroid function test (Table 14). Mean value of serum Ferritin was 941 ± 608.490 ng/ml in Group 1(Irregularly transfused) and Mean value of serum Ferritin was 1403 ± 685.584ng/ml in Group 2 (Regularly transfused) (Table 15).
Table 1
Age distribution between irregularly transfused and regularly transfused patients:
Table 1 Showing, Out of 200 patients 38(38.3%) were between 2-3completed years, 33(32.4%) were between 4-5 completed years, 44(37%) were between 6-7 completed years, 36(30.3%) were between 8-9 completed years and 49 (62%) were between 10-12 years.
Table 2
Distribution of age at diagnosis between irregularly transfused and regularly transfused patients
Table 2 Shows 37(18.5%) was diagnosed <12months, 108(54%) was diagnosed between 1-2 years, 53(26.5%) was diagnosed between 2-3 years and 1% was diagnosed after 3 years.
Figure 1
Distribution of age at diagnosis of thalassemia between irregularly transfused and regularly transfused patients
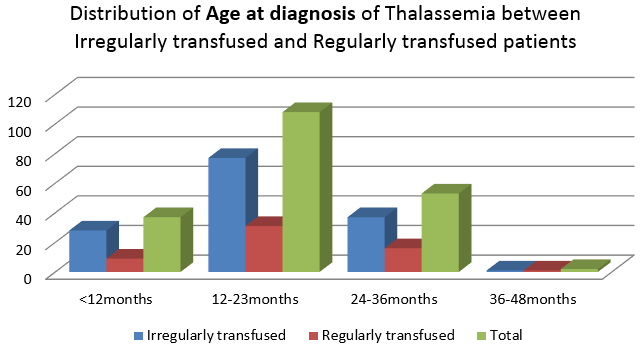
Table 3
Showing distribution of religion between irregularly and regularly transfused patients
Table 3 Showing among 143 of irregularly transfused patients 64(76.1%) were Hindu and 79(68.1%) were Muslim and among 57 of regularly transfused patients 20(23.9%) were Hindu and 37(31.9%) were Muslim. Here, the P-value is >0.005, indicating no statistical significance between Religion of the patients and the type of transfusion.
Table 4
Distribution of W/A (weight/age) in percentiles in irregularly and regularly transfused patients of 2-5 years using WHO growth chart
Table 4.1 Showing among 51 of irregularly transfused patients of 2-5 years, 9(17.7%) had W/A <3rd percentile, 24(47.1%) had W/A 3rd-15th percentile and 6 had W/A 50th-97th and only 2(3.9%) had W/A >97th percentile. Among 20 of regularly transfused patients of 2-5 years 3(15%) had W/A <3rd percentile, 3(15%) had W/A 3rd-15th percentile, and 7 had W/A 50th-97th and only 1(15%) had W/A >97th percentile. Here, the P-value is >0.005.
Figure 2
Distribution of W/A (weight/age) in percentiles in irregularly and regularly transfused patients of 2-5 years
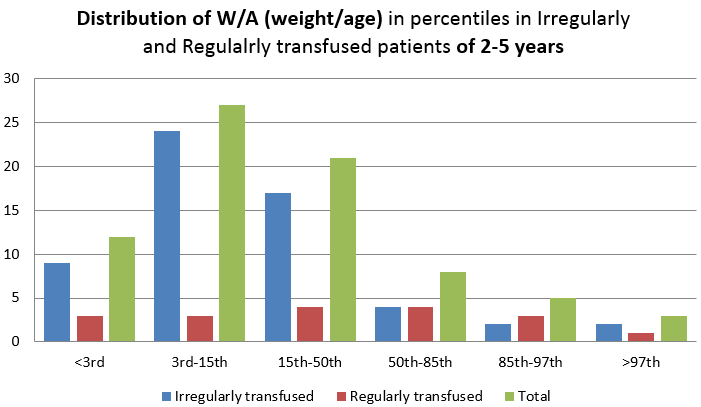
Table 0
Table 4.2 Showing among 92 of irregularly transfused patients of 5-12 years, 8(8.6%) had W/A <3rd percentile, 39(42.5%) had W/A 3rd-15th percentile, 20 had W/A 10th-25th, 24(26.1%) had H/A 25th-97th and only 1(1.1%) had W/A >97th percentile. Among 37 of regularly transfused patients of 5-12 years 3(8.4%) had W/A <3rd percentile, 5(13.5%) had W/A 3rd-15th percentile, 12 had W/A 10th-25th, 15(40.3%) and only 2(5.4%) had W/A >97th percentile. Here, the P-value is <0.005.
Figure 3
Distribution of W/A (weight/age) in percentiles in irregularly and regularly transfused patients of 5-12 years
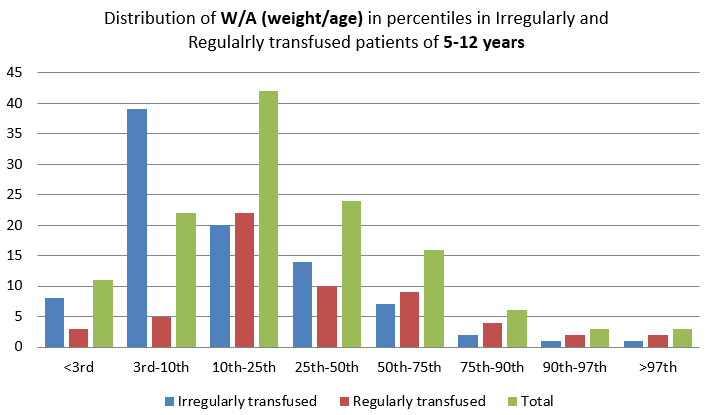
Table 5
Distribution of H/A (Height/age) in percentiles in irregularly and regularly transfused patients of 2-5 years using WHO growth chart
Table 6 Shows among 51 of irregularly transfused patients of 2-5 years, 11(21.5%) had H/A <3rd percentile, 16(31.3%) had H/A 3rd-15th percentile and 24(47.2%) had H/A 15th-97th. Among 20 of regularly transfused patients of 2-5 years 3(15%) had H/A <3rd percentile, 5(25%) had H/A 3rd-15th percentile, and 11(55%) had H/A 15th-97th and only 1(5%) had H/A >97th percentile. Here, the P-value is <0.005.
Figure 4
Distribution of H/A (Height/age) in percentiles in irregularly and regularly transfused patients of 2-5 years
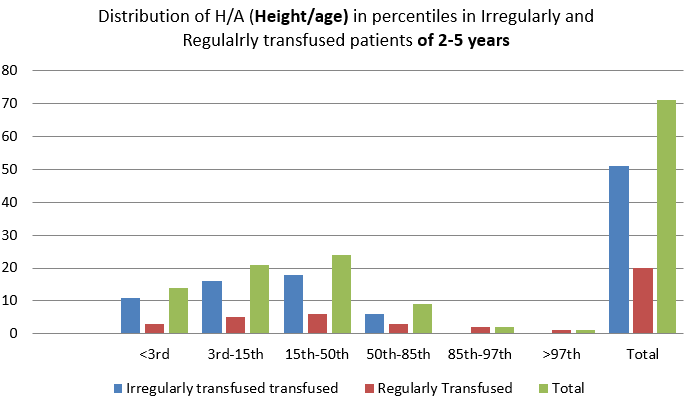
Table 0
Table 4.2 Shows among 92 of irregularly transfused patients of 5-12 years, 25(27.1%) had H/A <3rd percentile, 29(31.5%) had H/A 3rd-10th percentile, 20(21.7%) had H/A 10th-25th, 18(19.4%) had H/A 25th-97th. Among 37 of regularly transfused patients of 5-12 years 8(21.6%) had H/A <3rd percentile, 8(21.6%) had H/A 3rd-10th percentile, 12 had H/A 10th-25th, 15(32.4%), 9(24.4%) had H/A 25th-90th. Here, the P-value is <0.005.
Figure 5
Distribution of H/A (Height/age) in percentiles in irregularly and regularly transfused patients of 5-12 years
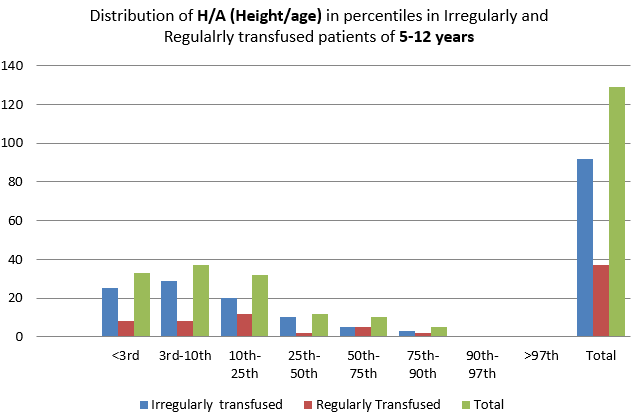
Table 6
Distribution of BMI (Body Mass Index) percentiles between irregularly and regularly transfused patients.
Table 8 Shows among irregularly transfused group, majority of them, 37(40.2%) out of 92 had BMI between 50th-85th percentiles. 53(57.5%) had BMI between 10th-50th percentiles. No one has BMI <3rd or >97th in this group. Among regularly transfused group, 21(56.8%) had BMI between 25th-50th percentiles, 3(81%) had BMI <5th percentiles. Here, the P-value is <0.005.
Figure 6
Distribution of BMI (Body Mass Index) percentiles between irregularly and regularly transfused patients.
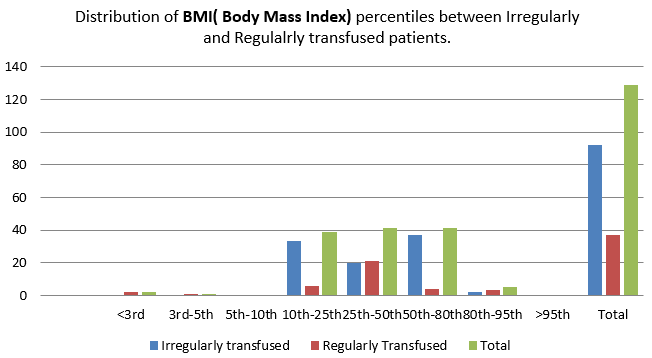
Table 7
Attainment of puberty between irregularly and regularly transfused patients of 10-12 years.
|
Group |
Puberty |
P Value |
|||
|
Attained/ SMR ≥ Stage 2 |
Delayed/ SMR stage 1 |
||||
|
Number(n) |
Percentage (%) |
Number(n) |
Percentage (%) |
||
|
Irregularly transfused |
2 |
13.3% |
13 |
86.7% |
0.025 |
|
Regularly transfused |
1 |
3.3% |
29 |
96.7% |
|
Table 8 Shows among irregularly transfused patients, 13(86.7%) out of 15 had delayed puberty and among regularly transfused patients, 29(96.7%) out of 30 had delayed puberty. P value is >0.005.
Table 8
Distribution of US: LS (Upper segment: Lower segment) RATIO between irregularly and regularly transfused patients of 2-12 years.
|
Age group |
Mean US:LS ratio |
|
|
Irregularly transfused |
Regularly transfused |
|
|
2-3years |
1.3:1.0 |
1.34:1.0 |
|
4-7years |
1.2:1.0 |
1.19:1.0 |
|
8-10years |
1.1:1.0 |
1.1:1.0 |
|
11-12years |
1:1 |
1:1 |
Table 0
|
Group |
Upper segment |
Lower segment |
||
|
Mean |
SD |
Mean |
SD |
|
|
Irregular |
57.71cm |
5.765cm |
59.91cm |
8.019cm |
|
Regular |
63.42cm |
5.247cm |
63.00cm |
7.462cm |
Table 9
Distribution of MUAC (Mid upper-arm circumference) between irregularly and regularly transfused patients up to 5 years.
Table 0
|
MUAC |
Minimum |
Maximum |
Mean |
SD |
|
Irregularly transfused |
10.5cm |
15cm |
12.2cm |
1.202 |
|
Regularly transfused |
10.5cm |
16cm |
12.98cm |
1.199 |
Table 10
Distribution of involvement of other systems between irregularly and regularly transfused patients of 2-12 years.
Table 11
Distribution of serum ferritin (ng /ml) between irregularly and regularly transfused patients of 2-12 years.
Table 4. Shows among irregularly transfused group 9(17.6%) out of 51 had MUAC <11.5cm, indicating severe acute malnutrition, 32(62.7%) had borderline MUAC and 10(19.7%) had normal MUAC. Among regularly transfused group 5(25%) out of 20 had MUAC <11.5cm, indicating severe acute malnutrition,
Table 0
|
Studies |
W/A <3rd perecntile |
|
|
Gomber S et al (2006)5 |
30.8% |
|
|
Pemde HK et al (2001)6 |
13.3% |
|
|
Singhal et al (2012)7 |
74% |
|
|
Hashemi A et al (2011)8 |
61% |
|
|
Present Study |
Irregularly transfused |
11.8% |
|
Regularly transfused |
10.5% |
|
Table 0
|
Studies |
H/A <3rd percentile |
|
|
Gomber S et al (2006)5 |
75% |
|
|
Pemde HK et al (2001)6 |
33.11% |
|
|
Singhal et al (2012)7 |
55% |
|
|
Yesillipek MA et al (1993)9 |
32.45% |
|
|
Present Study |
Irregularly transfused |
25.17% |
|
Regularly transfused |
19.17% |
|
Table 0
|
Studies |
Delayed Puberty |
|
|
Nazar Baker et al (2013)10 |
97.5% |
|
|
Yesillipek MA (1993)9 |
74.5% |
|
|
Anita Saxena et al.11 |
100% of boys and 98.2% of girls |
|
|
Present Study |
Irregularly transfused |
86.7% |
|
Regularly transfused |
96.7% |
|
6(30%) had borderline MUAC and 9(45%) had normal MUAC. Here, the P-value is <0.005.
Table 9 Shows mean US: LS ration between 2-3 years is 1.3:1 and 1.34:1 and between 4-7 years is 1.2:1 and 1.19:1 in irregularly and regularly transfused patients respectively and between 8-10 years it is 1.1:1 in both groups and between 11-12 years it is 1:1 in both groups.
Table 2 Shows Mean value of serum Ferritin was 941 ng/ml in Group 1 (Irregularly transfused) with a SD of 608.490 and Mean value of serum Ferritin was 1403 ng/ml in Group 2 (Regularly transfused) with a SD of 685.584.
Minimum and maximum value of serum Ferritin was 145 ng/ml and 1403 ng/ml respectively. Here, the P-value is <0.005.
Discussion
The aim of the study was to study the physical growth in children who have been transfused at least for one year and compare the growth among regularly and irregularly transfused thalassemic children. Among the 200 children, 143 (71.5%) were taking regular (2-4 weekly) transfusion therapy and 57 (28.5%) were taking irregular(>4weekly) transfusion.
The age distribution of thalassaemia major patient in study of V.P Chaudhary et al. 12 was 4-12 years (Mean age = 7.8 yrs), Anice George et al.13 was 0-18 years (Mean age = 11.3 yrs) and Nadeem ikram et al.14 was 0 to 21 years (Mean age = 15.4 yrs) which is comparable o present study with 2-12 yrs (Mean age = 9 yrs).
In the present study the minimum age of diagnosis 8 months and maximum 48 months mean age of diagnosis being 18.8 months ± 7.3 months. Nadeem Ikram et al.(2004)14 found the mean age of diagnosis to be 16 months with minimum age being 6 months and maximum age being 30 months. Minimum age of diagnosis is late in present study probably due to multiple factors. It may be due to lack of awareness of the parents of the population group at large, diagnostic laboratory facilities, poor knowledge of the care providers. In the present study, 58% were males and 42% were females. V.P Chaudhary et al.12 reported in his study that 54.9% were male and 45.1% were female. Study done by Anice George et al.13 reported that 60% were male and 40% were female. Nadeem Ikram et al.14 reported that 64% were male and 36% were female and Pemde HK et al. (2001)6 reported that 58% were males and 42% were females. For higher number of male in present study and all other studies is probably because male children are getting more psychosocial preference over female children in our country though P-value came to be >0.005. In the present study population, 42% belong to Hindu families, 58% to Muslim families and none from Christian community. Reddy et al. (1975)15 & Maheshwari et al. (1979)16 both of them in their studies showed that 75% were Hindus and 25% were Muslims. W/A below 3rd percentile in our study is also comparable to other studies. The decrease in incidence in our study is probably due to higher implementation of many nutritional programmes. From our study it is seen that irregularly transfused are affected more than regularly transfused children though it was not statistically significant in 2-5 years of age but it is statistically significant in 5 to 12 years of age.H/A below 3rd percentile in our study is also comparable to other studies. It is shown in the our study that Thalassaemia children are stunted but stunting is more seen in irregularly transfused children and the p-value is Statistically significant. The percentage of W/A <3rd percentile is less in present study compared to other studies. Again it may be due to increase in number of nutritional supplementation programmes by government which was not present earlier. In the present study children 61% had normal BMI and only 5.4 % had BMI less than 3rd percentile. Pemde HK et al. (2001)$ observed that 24.1 9% of the study subjects had BMI less than 3rd percentile. In our study it is statistically significant as P value is less than 0.005. High percentage of normal BMI is seen mainly because the children has stunting along the underweight.
Attainment of puberty in our study is also comparable to other studies. The possible reason behind more percentage of delayed puberty among regularly transfused group is that the more will be number of the blood transfusions, more will be iron deposition and may be due to poor adherence to chelation therapy difficult to explain, may be due to other nutritional and socio-economic factors. From our study it is observed that stunting was present but it was proportion of US:LS ratio was unaffected.
Mean MUAC in the present study was 12.44 cm compared to 14.72 cm in the study of Anice George et al.5, 7, 8, 9, 10, 11 indicating mild-to-moderate under nutrition. Most of the children whose haemoglobin is less than 5gm/dl had W/A and H/A either <3rd percentile or between 3rd-15th percentile. Among the children who had haemoglobin level >8 gm/dl, none had W/A <3rd percentile and 16% of them had H/A <3rd percentile. This shows that pre transfusion haemoglobin level maintained well above 8 gm/dl will have normal growth in most of the cases. So, the present study is having positive correlation of growth with pre-transfusion haemoglobin. Serum ferritin level was as expected in our study and involvements of other organs were also there as described previously.
Limitations
Age group of study population ranged from 2-12 years. So, pubertal assessment could not be done completely as we could not follow up the children up to 18 years.
Causes of stunting were not looked into as free Growth Hormone assay could not be done.
No growth charts were available for the local population.
Longitudinal study would have been better than cross-sectional study to evaluate the growth velocity. It was cross-sectional study.


