Introduction
Nursing students are exposed to different stressors and are vulnerable to stressful situations from the student life. Nursing as a caring profession has been known to be a stressful profession.1, 2 Nursing students during their clinical posting exposed to clinical duties in different settings experience wide range stressors same as professional nurses. In addition, nursing students also have stress related to their education and personal or social experience.3 Stress can be deleterious and can lead to physical and psychological distress to students. This psychological distress may hamper students' academic performance and hence impede their pursuit of the nursing career temporarily or permanently. Physical and psychological distress have negative effects on the workforce of nursing students.4 There is various existing evidence that indicate nursing students have higher levels of stress than students in other disciplines but stress varies at different educational levels of nursing students and at different nursing programs.5 Common sources of stress to nursing students basically include
Stress related to academic areas such as assignment workload, lack of knowledge regarding nursing, examination, teaching style.
Stress experienced during clinical practice, for example, lack of competency, assessment, supervision, shift changes, care of death and dying.6
Stress related to establishing relationships with others (clients, peers, teachers or other health professionals)
Stress due to personal factors such as gender, age, new surroundings away from home, family structure, financial burdens and job role.7
Materials and Methods
Research approach
In view of the nature of the problem under study and to accomplish the objectives of the study, quantitative research approach was found to be appropriate to assess the stress among 1st year B.Sc. Nursing students. This type of approach is based on the measurement of quantity. In this type of research, data is collected in numerical form and analyzed by using descriptive or inferential statistics.
Review literature
Kalavathi MB, Shabana S, Rajeswari H, Indira (2015) (n=60) to assess level of stress among the 1st year B.Sc. Nursing students at Narayana College of Nursing, Nellore, which showed significant relation of level of stress with demographic variables (mother’s education, father’s education, family income per month, type of family and awareness about nursing profession).
Lydia C, Anchala M, Hemamalini (2016)[(n=80) to assess the level of academic stress among nursing students at SRM college of nursing, Kattankulathur, which showed that there was a significant relationship of level of stress with demographic variables (age, type of family, participation in recreational activities).[1]
Mahfouz R, Alsahli H in (2016) (n=51) on perceived stress and coping strategies among newly nurse students in clinical practice in different hospitals, at the Nursing College, Princess Nourah University, which showed that there was significant relationship of level of perceived stress with demographic variables (age, type of family, education of mother, occupation of father, occupation of mother, distance, type of residence).2
Analysis
Distribution of study subjects according to the demographic variables:
This section deals with the distribution of study subjects according to their socio-demographic variables. The data obtained are described in terms of Age, Gender, Total monthly income of the family, Residence and Type of family.
Table 1
Table 2
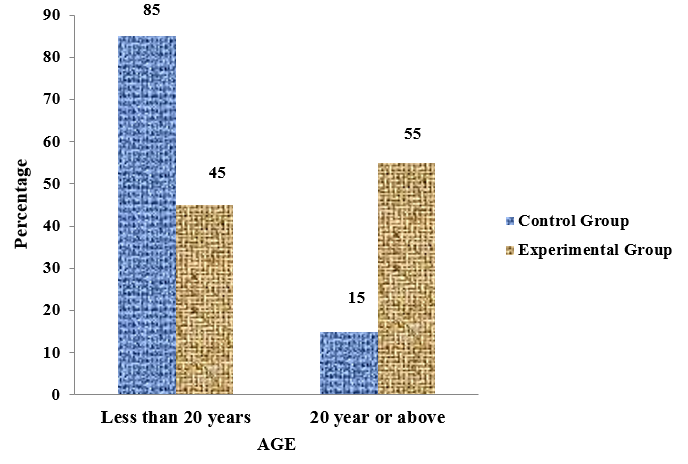
Distribution of the study subjects as per their Age N=40
|
Age |
Control (n 1 =20) |
Control f (%) |
Experimental (n 2 =20) |
Experimental f (%) |
|
Less than 20 years |
17 |
85 |
9 |
45 |
|
20 year or above |
3 |
15 |
11 |
55 |
The data in the table (8) and figure (4) shows 17(85%) study subjects in the control group and 9(45%) study subjects in the experimental group were less than 20 years and 3(15%) study subjects in the control group and 11(55%) study subjects in the experimental group were 20 year and above.Table 2
Table 3
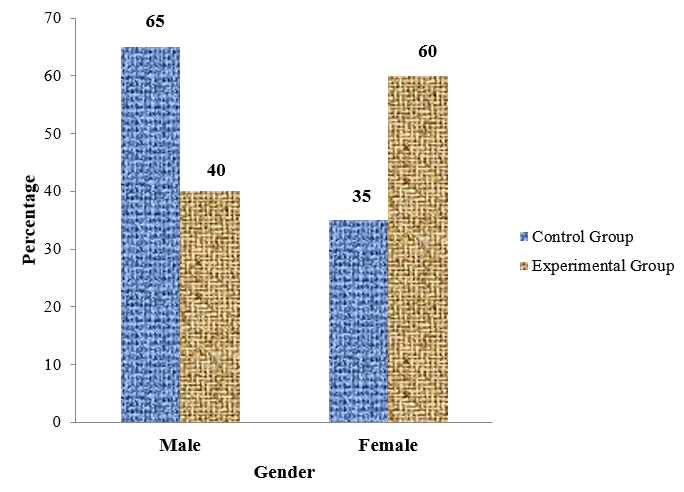
Distribution of the study subjects according to Gender N=40
|
Gender |
Control (n1=20) |
Control f (%) |
Experimental (n2=20) |
Experimental f (%) |
|
Male |
13 |
65 |
8 |
40 |
|
Female |
7 |
35 |
12 |
60 |
The data presented in table and figure shows that 13 (65%) study subjects in the control group and 8 (40%) study subjects in the experimental group were Males and 7 (35%) study subjects in the control group and 12(60%) study subjects in the experimental group were Females.Table 3
Table 4
Distribution of the study subjects according to total monthly income of the family. N=40
|
Total Monthly Income of Family |
Control (n1=20) |
Control f (%) |
Experimental (n2=20) |
Experimental f (%) |
|
Below Rs.10,000 |
11 |
55 |
6 |
30 |
|
Rs.10,000-20,000 |
8 |
40 |
6 |
30 |
|
Above Rs. 20,000 |
1 |
5 |
8 |
40 |
Figure 3
Percentage distribution of the study subjects according to total monthly income of the family.
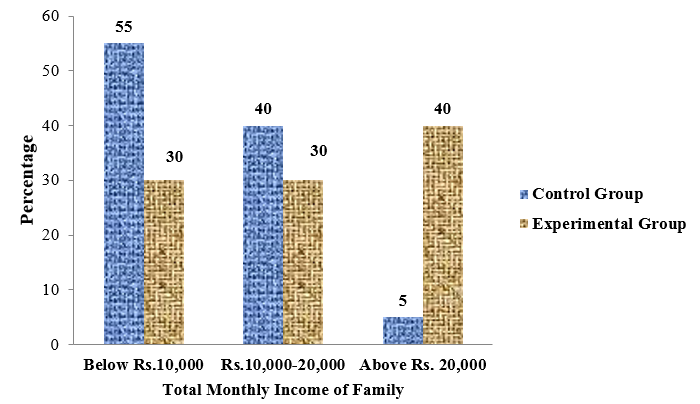
The data presented in table and figure shows that out of 40 study subjects 11(55%) in the control group and 6(30%) study subjects in the experimental group belonged to the group with total monthly income below Rs.10,000, Whereas 8 (40%) study subjects in the control group and 6(30%) study subjects in the experimental group belonged to group of Rs.10,000-20,000 of monthly income, 1(5%) study subjects in the control group and 8(40%) study subjects in the experimental group belonged to group of above Rs. 20,000 of monthly income.Table 4
Table 5
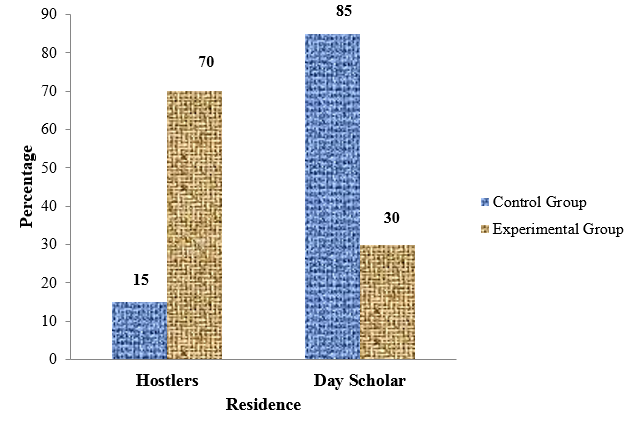
Distribution of the study subjects according to Residence. N=40
|
Residence |
Control (n1=20) |
Control f (%) |
Experimental (n2=20) |
Experimental f (%) |
|
Hostlers |
3 |
15 |
14 |
70 |
|
Day Scholar |
17 |
85 |
6 |
30 |
The data presented in table and figure shows that 3 (15%) study subjects in the control group and 14(70%) study subjects in the experimental group were hostlers, 17 (85%) study subjects in the control group and 6(30%) study subjects in the experimental group were day scholars.Table 5
Table 6
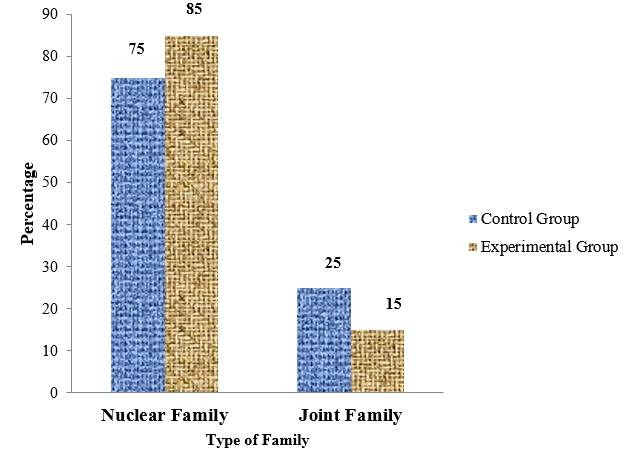
Distribution of the study subjects according to Type of family. N=40
|
Type of Family |
Control (n1=20) |
Control f (%) |
Experimental (n2=20) |
Experimental f (%) |
|
Nuclear Family |
15 |
75 |
17 |
85 |
|
Joint Family |
5 |
25 |
3 |
15 |
The data presented in table 6 and figure 5 shows that 15(75%) study subjects in the control group and 17(85%) study subjects in the experimental group belonged to the nuclear family whereas 5(25%) study subjects in the control group and 3(15%) study subjects in the experimental group belonged to the joint family.?
Table 7
Association of stress with demographic variables among nursing students N=40
The data in Table 1 presented in the table indicates that there was statistically significant association between stress level scores of subjects with their Age (p=0.008), Total monthly income of family (p=0.027) and Residence (p=0.000) while as no association was found with other demographic variables such as gender , and type of family of study subjects. Hence, the researcher rejected the null hypothesis (H02) which states that there is no significant association of level of stress scores in the control and the experimental group of Nursing students with demographic variables (age, total monthly income of the family and residence) and accepted the research hypothesis (H2) which states that there is significant association of pre-interventional level of stress scores in the control and the experimental group of Nursing students with demographic variables (age, total monthly income of the family and residence). Also the researcher accepted the null hypothesis (H02) which states that there is no significant association of pre-interventional level of stress scores among Nursing students with demographic variables (gender and type of family).
Results
The distribution according to age: 9(45%) study subjects in the experimental group and 17(85%) study subjects in the control group were less than 20 years and 11(55%) study subjects in the experimental group and 3(15%) study subjects in the control group were 20 year and above.
The distribution of study subjects according to gender: 8 (40%) study subjects in the experimental group and 13 (65%) study subjects in the control group were Males and 12(60%) study subjects in the experimental group and 7 (35%) study subjects in the control group were Females.
The distribution according to total monthly income of the family: 6(30%) study subjects in the experimental group and 11(55%) study subjects in the control group belonged to the group with monthly income below Rs.10,000, Whereas 6(30%) study subjects in the experimental group and 8 (40%) study subjects in the control group belonged to group of Rs.10,000-20,000 of monthly income, whereas 8(40%) study subjects in the experimental group and 1(5%) study subjects in the control group belonged to group of above Rs.20,000 of monthly income.
The distribution according to residence: 14(70%) study subjects in the experimental group and 3 (15%) study subjects in the control group were hostellers and 6(30%) study subjects in the experimental group and 17 (85 %) study subjects in the control group were day scholars.
The distribution of study subjects according to type of family: 17(85%) study subjects in the experimental group and 15(75%) study subjects in the control group belong to the nuclear family whereas 3(15%) study subjects in the experimental group and 5 (25%) study subjects in the control group belong to the joint family.
Conclusion/ Discussion
Findings of the present study revealed that there was statistically significant association of level of stress score in the control and the experimental group with the age, total monthly income of the family, and residence of the study subjects with (p=0.008),(p=0.027), and (p=0.000) respectively, while as no association was found between pre-interventional level of stress scores in the control and the experimental group with other demographic variables like gender (p=0.113), and type of family (p=0.429) at 0.05 level of significance.

